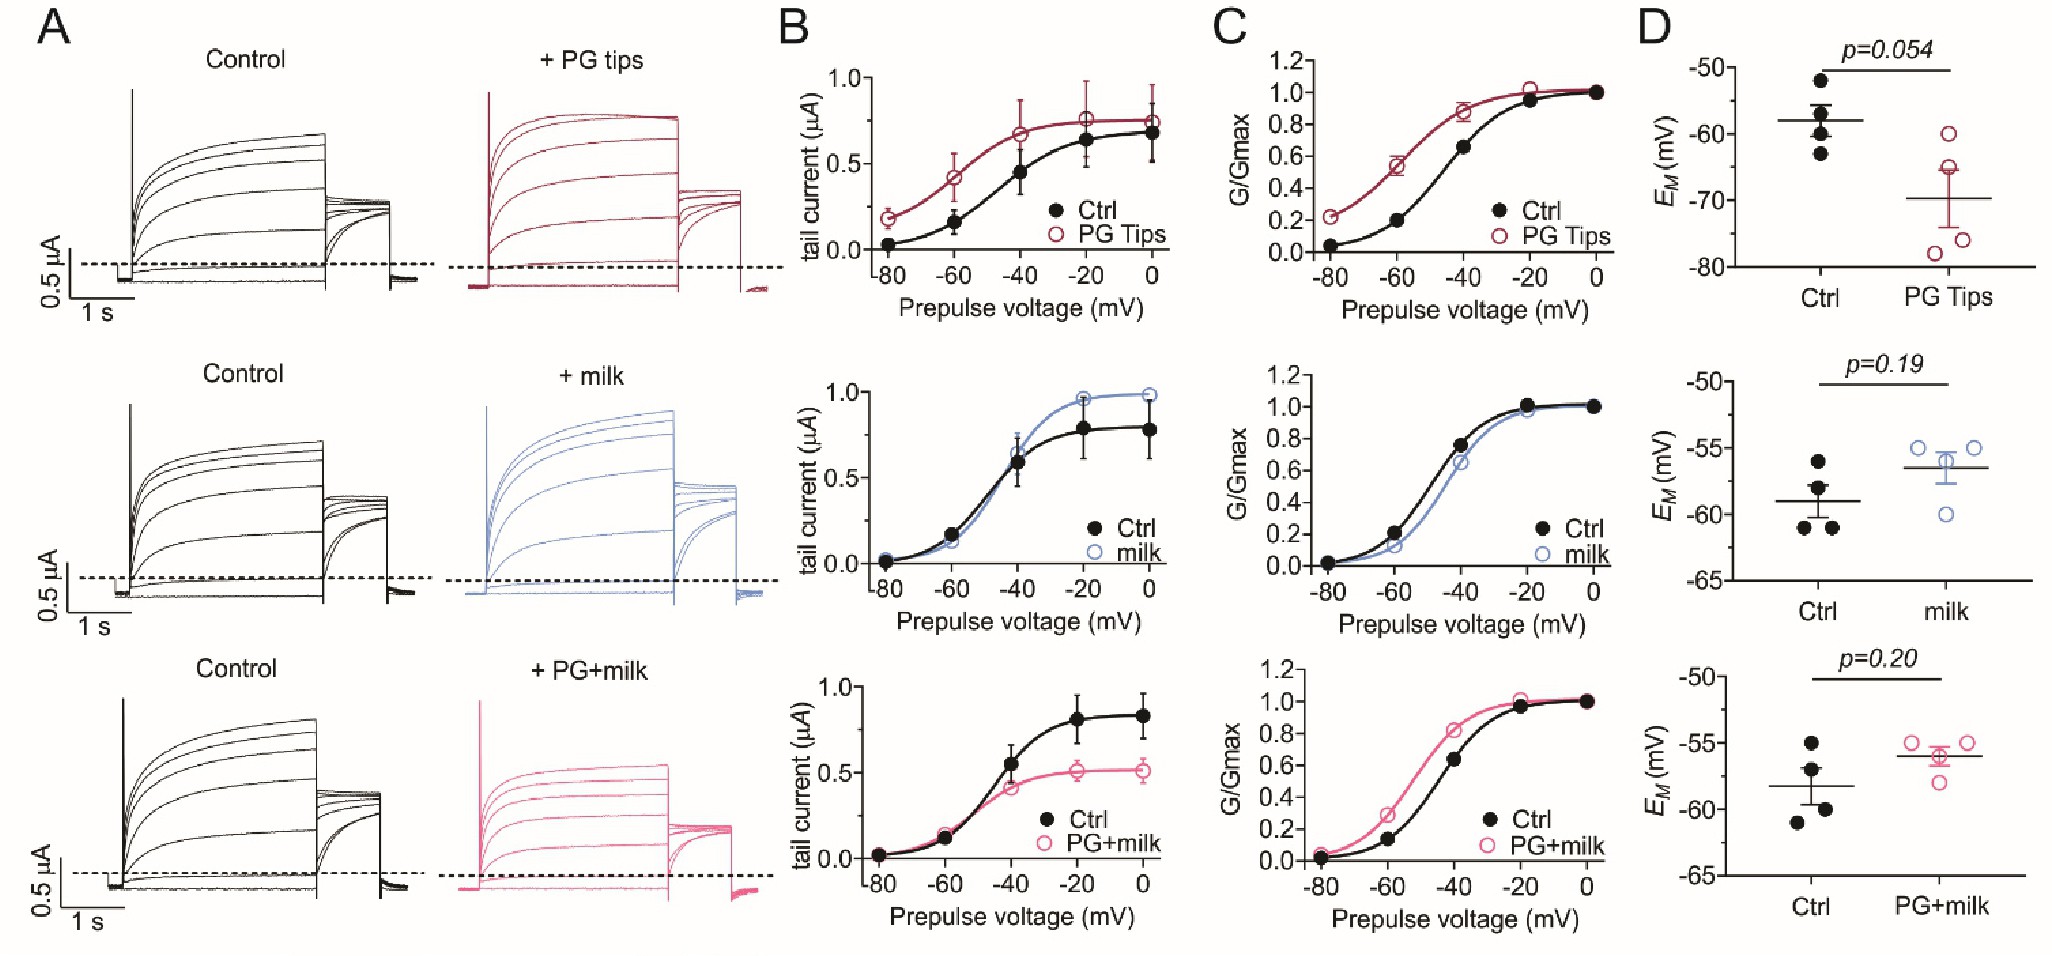
Fig. 3. Black tea activates KCNQ5, an effect inhibited by milk. All error bars indicate SEM. A: Mean KCNQ5 current traces in the absence (Control) and presence of 1% extract of PG Tips brand black tea and/or milk (n = 4-5). B: Mean tail current versus prepulse voltage for traces as in A (n = 4-5). C: Mean normalized tail current (G/Gmax) versus prepulse voltage for traces as in A (n = 4-5). D: Scatter plot of unclamped membrane potential (EM) for cells as in A (n = 4-5). Statistical analyses by two-way ANOVA.